Figure 3b: SUBDISTRICTS WITH THE GREATEST NUMBER OF FIRE ALERTS
SUBDISTRICT
ISLAND
NUMBER OF FIRE ALERTS
TULUNG SELAPAN
Sumatra
505
AIR SUGIHAN
Sumatra
359
CENGAL
Sumatra
163
PEMATANG PANGGANG
Sumatra
31
RAMBANG DANGKU
Sumatra
25
BANYUASIN 2
Sumatra
25
LAIS
Sumatra
18
SADU
Sumatra
16
MADANG SUKU II
Sumatra
16
PAMPANGAN
Sumatra
14
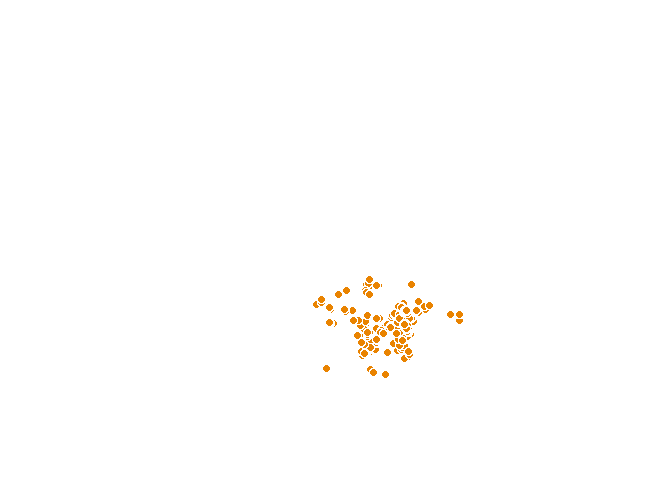
Figure 4: FIRE ALERT COUNT JAN 1, 2013 - PRESENT
Figure 5: COMPANY CONCESSIONS WITH FIRE ALERTS
PULPWOOD CONCESSIONS WITH THE HIGHEST SHARE OF FIRE ALERTS
NAME
NUMBER OF FIRE ALERTS
PT. BUMI ANDALAS PERMAI 1
540
PT. SEBANGUN BUMI ANDALAS WOOD INDUSTRIES
231
PT. BUMI MEKAR HIJAU 5
146
PT. BUMI ANDALAS PERMAI 2
37
PT. BUMI MEKAR HIJAU 4
12
PT. BUMI MEKAR HIJAU 3
10
PT. RIMBA HUTANI MAS 5
7
PT. WAHANA LESTARI MAKMUR SUKSES 1
7
PT. PARAMITRA MULIA LANGGENG 3
6
PALM OIL CONCESSIONS WITH THE HIGHEST SHARE OF FIRE ALERTS
NAME
NUMBER OF FIRE ALERTS
PT. ERAMITRA AGRO LESTARI
10
PT. DENDYMARKER INDAH LESTARI 1
5
PT. PN VI PERSERO /DH. PERKEB IV (DURIAN LUNCUK
5
PT. WACHYUNI MANDIRA
3
PT. ROEMPOEN ENAM BERSAUDARA
2
PT. INDO LAMPUNG PERKASA
2
Wilmar - PT Tania Selatan – Burnai Timur POM
1
LOGGING CONCESSIONS WITH THE HIGHEST SHARE OF FIRE ALERTS
NAME
NUMBER OF FIRE ALERTS
Figure 6: RSPO CERTIFIED CONCESSIONS WITH FIRE ALERTS
CONCESSION TYPE
NUMBER OF FIRE ALERTS
RSPO CERTIFIED PALM OIL CONCESSIONS
1
ALL PALM OIL CONCESSIONS
28
Figure 7: FIRE ALERTS BY LAND USE AREA
Figure 8: FIRE ALERTS IN PROTECTED AREAS
Figure 9: PORTION OF FIRES OCCURRING ON PEATLAND
Figure 10: PORTION OF FIRES OCCURRING IN AN INDICATIVE MORATORIUM AREA
WRI
used NASA’s Active Fire Data to determine the likely location of fires
on the ground. This system uses the NASA MODIS satellites that survey
the entire earth every 1-2 days. The sensors on these satellites detect
the heat signatures of fires within the infrared spectral band. When the
satellite imagery is processed, an algorithm searches for fire-like
signatures. When a fire is detected, the system indicates the 1 km2
where the fire occurred with an “alert.” The system will nearly always
detect fires of 1,000 m2 in size, but under ideal conditions, can detect
flaming fires as small as 50 m2. Since each satellite passes over the
equator twice a day, these alerts can be provided in near-real time.
Fire alerts are posted on the NASA FIRMS website within 3 hours of
detection by the satellite.
The accuracy of fire detection has
improved greatly since fire detection systems were first developed for
the MODIS satellites. Today, the rate of false positives is 1/10 to
1/1000 what it was under earlier systems first developed in the early
2000s. The algorithm used to detect fires includes steps to eliminate
sources of false positives from sun glint, water glint, hot desert
environments and others. When the system does not have enough
information to detect a fire conclusively, the fire alert is discarded.
In general, night observations have higher accuracy than daytime
observations. Desert ecosystems have the highest rate of false
positives. Many papers have been published to validate the NASA MODIS
active fire alerts for use in various applications.
WRI is
employing a recommendation for detecting forest clearing fires
(described in Morton and Defries, 2008), identifying fires with a
Brightness value ≥330 Kelvin and a Confidence value ≥ 30% to indicate
fires that have a high confidence for being forest-clearing fires. Low
confidence fires are lower intensity fires that could either be from
non-forest-clearing fire activity (clearing fields or grass burning), or
could be older fires that have decreased in intensity (smoldering
rather than flaming fires). The use of this classification establishes a
higher standard for fire detection than using all fire alerts equally.
Sources:
NASA
FIRMS FAQ Morton, D., R. DeFries, J. T. Randerson, L. Giglio, W.
Schroeder, and G. van der Werf. 2008. Agricultural intensification
increases deforestation fire activity in Amazonia. Global Change Biology
14:2262-2276.
Data Sources for Figures:
NASA Fire Information for Resource Management (FIRMS) Active Fire Data
Administrative boundaries from GADM and Center for International Forestry Research (CIFOR)